At Mapchise, we specialize in location intelligence and competitor analysis, particularly in the restaurant industry. With over 75,000 restaurant closures tracked across the last four years, we set out to understand how competitive environments shape business outcomes.This report examines the role of competitor density, foot traffic, cuisine saturation, and brand size in determining which restaurants are more likely to close. Our findings offer a data-driven framework to support better site selection and smarter expansion strategies for restaurant operators.
Defining Trade Areas and Metrics
To understand local market dynamics, we first define the trade area—the geographic region from which a restaurant draws the majority of its customers. Recognizing that customer reach varies by location and brand, we use two consistent trade area categories:
- Nearby Trade Area: The area that contributes roughly 50% of a restaurant’s total foot traffic.
- Semi-Nearby Trade Area: A broader zone accounting for approximately 80% of foot traffic.
These definitions form the backbone of our competitive and foot traffic analysis, allowing for consistent comparisons across restaurant types, locations, and closures.
Competitive Pressure and Restaurant Closures
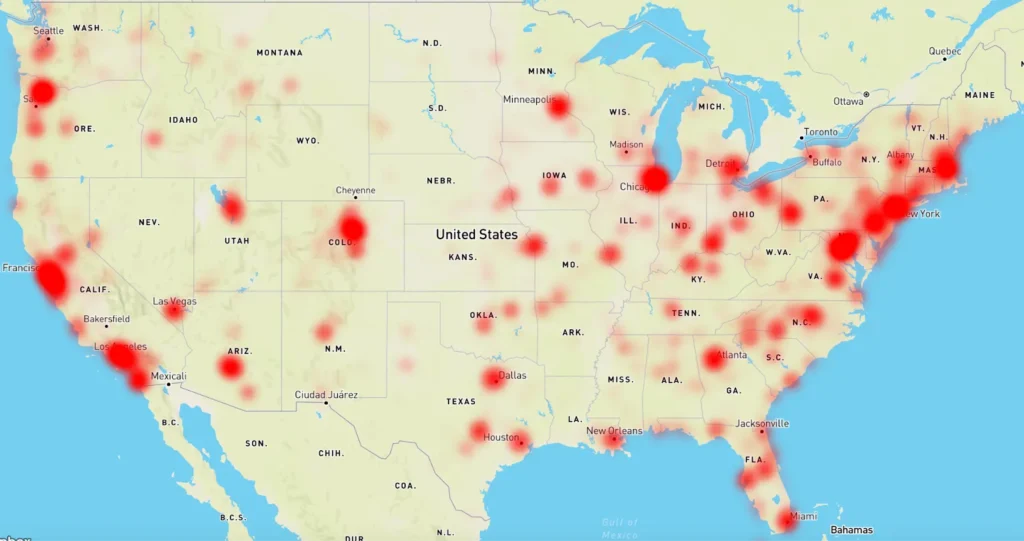
Our analysis reveals that restaurant closures tend to occur in crowded and competitive environments. On average, closed restaurant locations had:
- 55 competitors within their Semi-Nearby Trade Area.
- 8.5 competitors that also closed during the same four-year period.
- 3.6 closures from the same cuisine category, indicating subcategory-specific pressures.
These patterns highlight both the density of dining options and the high degree of churn, especially among similar types of restaurants. When multiple closures occur within the same cuisine, it suggests deeper factors at play, such as oversupply, shifting customer preferences, or demographic mismatches.
Foot Traffic Patterns Around Closed Restaurants
Direct foot traffic data isn’t available for closed restaurants, but by analyzing the performance of nearby competitors in the same cuisine, we identified three key patterns. Using a baseline where a foot traffic score of 1.0 represents the market average for restaurants in the area, we identified three primary patterns among closed locations:
1. Low Foot Traffic Areas (Index < 0.75)
- 41% of closures occurred in areas where nearby same-category competitors had below-average foot traffic.
- These locations had only 1.7 similar competitors on average.
- This suggests insufficient demand, poor location fit, or weak consumer interest in that cuisine.
2. Moderate Foot Traffic + High Competition (Index 0.75–1.25)
- 30% of closures happened where demand was average, but competitive density was high.
- These areas had an average of 3.2 same-category competitors.
- Likely cause: market saturation and difficulty standing out.
3. High Foot Traffic Areas (Index ≥ 1.25)
- 29% of closures occurred in areas with strong foot traffic and relatively few same-category competitors (2.0 on average).
- Closures here may be due to dominant competitors capturing most demand, leaving little room for others.
Competitor Density and Risk of Closure
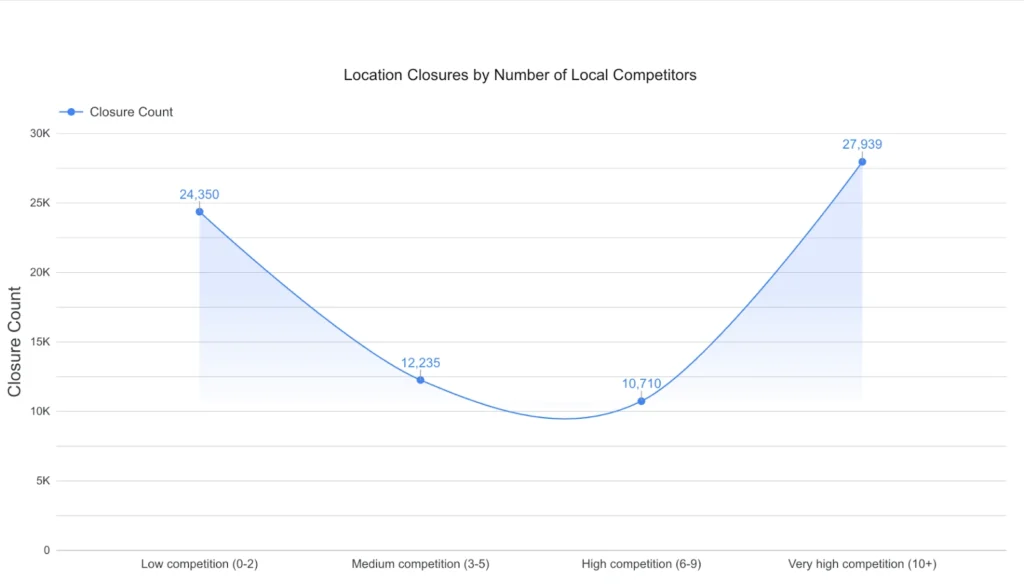
An analysis of competitive density around closed restaurant locations reveals a telling pattern: closures are most common in environments with either very low or very high competition. Specifically:
- 32% of closures occurred in areas with low competition (0–2 competitors), suggesting potential issues with local demand or poor market fit.
- 38% occurred in very high competition areas (10+ competitors), indicating market oversaturation and difficulty standing out.
Interestingly, fewer closures were observed in medium (3–5) and high (6–9) competition zones, where a balance between demand and competition may have been more favorable. This distribution suggests that both extremes of too little competition (and thus likely low demand) and too much competition (leading to margin pressure and customer fragmentation) can contribute significantly to restaurant failure.
Brand Size, Competition, and Closure Risk
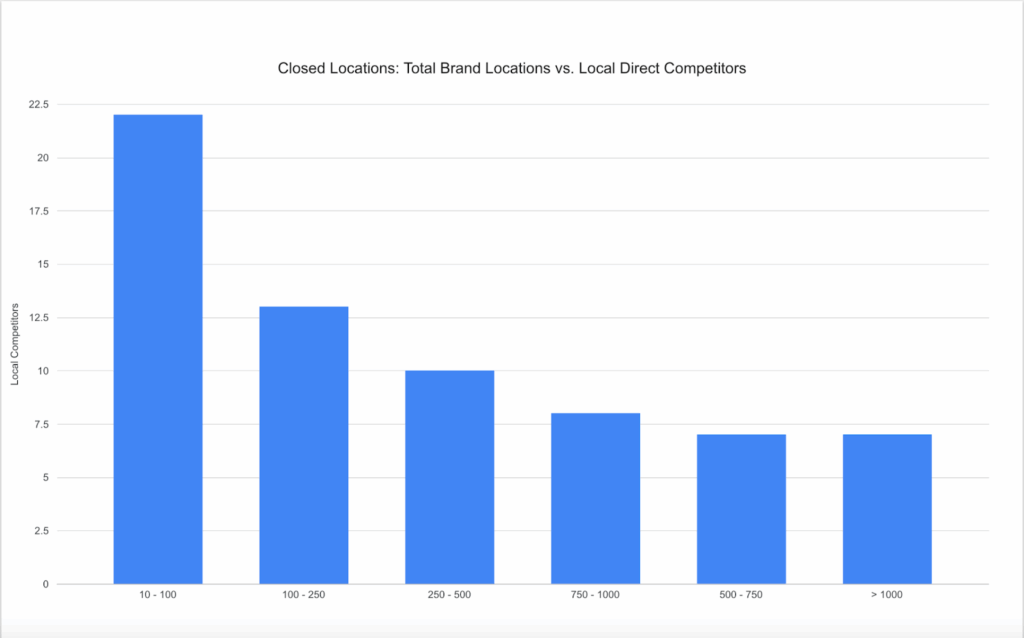
A brand’s total footprint significantly impacts its vulnerability to competition:
Smaller Brands (Fewer than 250 Locations)
- Faced higher local competition at the time of closure.
- Often expanded into established, high-traffic areas—where competition is fierce.
- Were more likely to be affected by external competition in their trade areas.
Larger Brands (250+ Locations)
- Showed a decline in the average number of nearby competitors at closure sites.
- Closure patterns suggest that internal factors like underperformance, operational efficiency, or intentional downsizing played a greater role.
- Customer cannibalization became a key issue. For instance:
- Closed Subway locations had, on average, 1.1 other Subways nearby.
- This overlap suggests demand splitting, weakening store performance.
Smarter Growth Starts with Better Data
Finding a location for your restaurant is complicated. Site selection is more than looking for a new
location: Don’t take the risk of business expansion without data – use Mapchise. At Mapchise, we
provide reliable data, fueling your research with our easy-to-use tool. Uncover crucial market
characteristics and expand your business with confidence. Sign up for a free demo and discover
smarter growth!